To complete an Axonometric circulation diagram you'll need to know two things ...
1) What is an Axonometric?
2) What is a circulation diagram?
What is an Axonometric?
An Axonometric is a two dimensional representation of three dimensional form. In this way it is similar to a perspective representation that you are probably familiar with. But in contrast to a perspective parallel line in an Axonometric stay parallel in the representation (note I'm using the term representation rather than drawing; Axonometrics could be drawings, like perspective drawings, but more often than not nowadays they are images rendered from digital models). The advantage of parallel lines staying parallel in the representation is that you are able to measure them and compare measurements between different parts knowing that the dimensions are not being distorted (as they are in a perspective).

Note: in SketchUp it takes an extra plugin or some fiddling with settings to get a true Axonometric, so to keep it easy just use Parallel Projection under Camera settings to achieve a similar effect, shown here:

There is a long history of architectural representation where the different representational forms, for example Axonometrics, Isometrics, Perspectives, Elevations, Sections, Plans, etc, have been used to serve various pragmatic and ideological causes. While the Perspective has been associated with the human body in all its sensuousness and, indeed, messiness, the Axonometric has been associated with the mind, in particular the minds eye. What constitutes the truth is a tricky subject ... but for a long time in Modern Architecture if Architects wanted to present the truth they had to use an Axonometric to do so. The body, and to a certain degree the end users of the building, were seen as an unwelcome imposition on an otherwise perfect design.
How do you feel about that? Do those ideas match with yours or societies in 2017?
Here are some examples of Axonometrics. In some you might see how the Architect has challenged some of the conventional understandings as described above. You might like to as well ...


What is a Circulation Diagram?
A circulation diagram shows how the Architect intends, or predicts, how people will move through the spaces within or around the building.
Take a look at the below for inspiration.


In the video below from 50 seconds you'll see animated versions of the circulation diagrams above.
PAR AND SERIES ET SERIES KEELUNG HARBOR COMPETITION ENTRY from Labtop on Vimeo.
1) What is an Axonometric?
2) What is a circulation diagram?
What is an Axonometric?
An Axonometric is a two dimensional representation of three dimensional form. In this way it is similar to a perspective representation that you are probably familiar with. But in contrast to a perspective parallel line in an Axonometric stay parallel in the representation (note I'm using the term representation rather than drawing; Axonometrics could be drawings, like perspective drawings, but more often than not nowadays they are images rendered from digital models). The advantage of parallel lines staying parallel in the representation is that you are able to measure them and compare measurements between different parts knowing that the dimensions are not being distorted (as they are in a perspective).

Note: in SketchUp it takes an extra plugin or some fiddling with settings to get a true Axonometric, so to keep it easy just use Parallel Projection under Camera settings to achieve a similar effect, shown here:

There is a long history of architectural representation where the different representational forms, for example Axonometrics, Isometrics, Perspectives, Elevations, Sections, Plans, etc, have been used to serve various pragmatic and ideological causes. While the Perspective has been associated with the human body in all its sensuousness and, indeed, messiness, the Axonometric has been associated with the mind, in particular the minds eye. What constitutes the truth is a tricky subject ... but for a long time in Modern Architecture if Architects wanted to present the truth they had to use an Axonometric to do so. The body, and to a certain degree the end users of the building, were seen as an unwelcome imposition on an otherwise perfect design.
How do you feel about that? Do those ideas match with yours or societies in 2017?
Here are some examples of Axonometrics. In some you might see how the Architect has challenged some of the conventional understandings as described above. You might like to as well ...

Le Corbusier showing front and back views of the same villa.
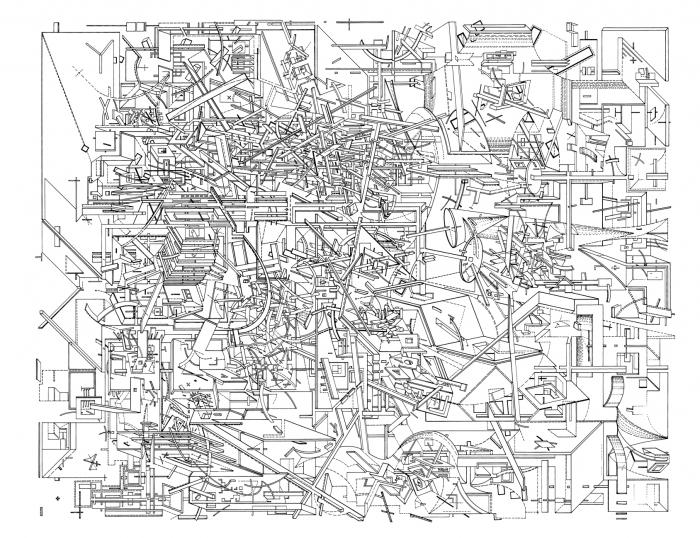
Libeskind challenging the Axonometric convention with a drawing called Micro Megas.

Eisenman designing Architecture so that it makes a good drawing!

BIG Architects, Exploded Axonometric, National Gallery Greenland.
What is a Circulation Diagram?
A circulation diagram shows how the Architect intends, or predicts, how people will move through the spaces within or around the building.
Take a look at the below for inspiration.

Zaha Hadid, different style of lines represent horizontal or vertical circulation.

Morphosis, the building becomes a ghost.

The different layers of this exploded Parallel Projection represent different time periods over the life of this museum.

UN Studio, Mobius House, you could imagine building the circulation "ribbons" in SketchUp.

Mobius House again, multiple pathways through the same Architecture.

Still images from the video below.
PAR AND SERIES ET SERIES KEELUNG HARBOR COMPETITION ENTRY from Labtop on Vimeo.
Comments
Post a Comment